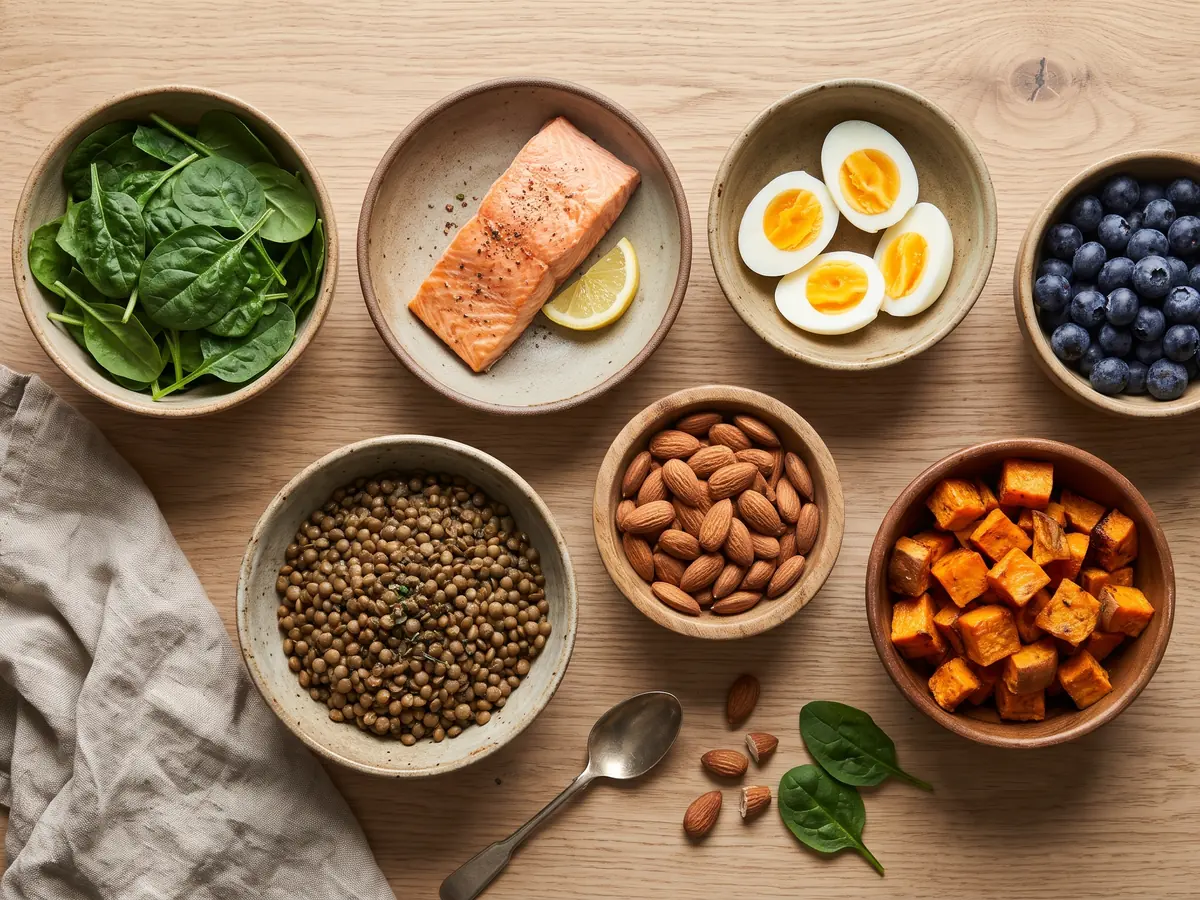
Short answerNutritional value is the mix of energy and nutrients a food provides: calories, protein, carbs, fat and fiber, plus vitamins and minerals. To compare foods fairly, look at what they give per 100 calories or check the %DV on the label, where 5% or less is low and 20% or more is high. Vegetables, beans, fish, lean meat, eggs, yogurt and fruit tend to give the most for their calories.
In this article
What is nutritional value?
The nutritional value of a food is what it contributes to your diet. That includes energy, measured in calories, and the nutrients that come with it: protein, carbohydrates, fat, fiber, vitamins, minerals and water. Two foods can have the same calories and very different nutritional value, because one brings protein, fiber and vitamins while the other brings mostly sugar or fat.
You'll also see the term nutrient value. It usually means the amount of one nutrient in a food. A navel orange has a nutrient value of 83 mg of vitamin C, for example, and 3 ounces of raw carrots have 586 mcg of vitamin A. Put all of those single numbers together and you have the full nutritional value of the food.
So what is nutrient value worth to you in practice? It tells you which foods help you reach a daily target. If you need more fiber, the fiber value matters. If you're watching sodium, the sodium value matters. The rest of this guide shows how to read those numbers and compare them.
The Dietary Guidelines for Americans, 2025–2030 use a related term: nutrient-dense foods. The guidelines ask people to "prioritize nutrient-dense foods and home-prepared meals" and to eat "a variety of colorful, nutrient-dense vegetables and fruits." A nutrient-dense food is one with high nutritional value for its calories, and with little added sugar, saturated fat or sodium. Our healthy food list gathers 50 of them by food group.
Macronutrients and micronutrients
The nutritional value of any food is built from two groups of nutrients. Macronutrients are the ones you eat in grams and that give calories. Micronutrients are the vitamins and minerals you need in milligrams or micrograms, and they give no calories at all. Together with water, they make up the 6 main nutrients.
Macronutrients
- Protein gives 4 calories per gram. It builds and repairs muscle and other tissue. The 2025–2030 Dietary Guidelines set a protein goal of 1.2 to 1.6 grams per kilogram of body weight per day.
- Carbohydrates give 4 calories per gram. They include sugars, starches and fiber. Fiber is counted as a carbohydrate on the label but most of it isn't digested, which is why it's tracked on its own line.
- Fat gives 9 calories per gram, more than twice as much as protein or carbs. That's why oils, nuts and cheese are calorie-dense even in small amounts.
Alcohol also gives calories, about 7 per gram, but it isn't a nutrient. You can see how your own calories split across the three macros with the macro calculator.
Micronutrients
Vitamins and minerals don't give energy, but your body can't run without them. The FDA sets a Daily Value for each one, which is the amount used on the Nutrition Facts label for adults and children 4 years and older. Some of the ones you'll see most often:
| Nutrient | Daily Value | FDA label advice |
|---|---|---|
| Dietary fiber | 28 g | More |
| Protein | 50 g | — |
| Vitamin D | 20 mcg | More |
| Calcium | 1,300 mg | More |
| Iron | 18 mg | More |
| Potassium | 4,700 mg | More |
| Vitamin C | 90 mg | — |
| Vitamin A | 900 mcg | — |
| Saturated fat | 20 g | Less |
| Sodium | 2,300 mg | Less |
| Added sugars | 50 g | Less |
The last column follows the FDA's own advice on the label. FDA lists dietary fiber, vitamin D, calcium, iron and potassium as nutrients to get more of, and saturated fat, sodium and added sugars as ones to get less of. A food's nutritional value looks better when it scores high on the first group and low on the second.
Nutrient density per 100 calories
Comparing foods per 100 grams is misleading. 100 grams of spinach has 23 calories, while 100 grams of almonds has 579. Spinach will always look "low" in everything per gram, and almonds will look "high." A fairer test is to compare foods at the same calories. Below is what 100 calories of each food gives you, worked out from USDA FoodData Central values.
| Food | Amount for 100 kcal | Protein | Fiber | Sat. fat | Sodium |
|---|---|---|---|---|---|
| Spinach, raw | 435 g | 12.4 g | 9.6 g | 0.3 g | 343 mg |
| Broccoli, cooked | 286 g | 6.8 g | 9.4 g | 0.2 g | 117 mg |
| Raspberries | 192 g | 2.3 g | 12.5 g | 0 g | 2 mg |
| Carrots, raw | 244 g | 2.3 g | 6.8 g | 0.1 g | 168 mg |
| Lentils, cooked | 86 g | 7.8 g | 6.8 g | 0.1 g | 2 mg |
| Black beans, cooked | 76 g | 6.7 g | 6.6 g | 0.1 g | 1 mg |
| Chicken breast, cooked | 61 g | 18.8 g | 0 g | 0.6 g | 45 mg |
| Greek yogurt, plain nonfat | 169 g | 17.3 g | 0 g | 0.2 g | 61 mg |
| Salmon, cooked | 49 g | 10.7 g | 0 g | 1.2 g | 30 mg |
| Egg, hard-boiled | 65 g | 8.1 g | 0 g | 2.1 g | 80 mg |
| Oats, dry | 26 g | 3.5 g | 2.7 g | 0.3 g | 2 mg |
| Banana | 112 g | 1.2 g | 2.9 g | 0.1 g | 1 mg |
| Almonds | 17 g | 3.7 g | 2.2 g | 0.7 g | 0 mg |
| Cheddar cheese | 24 g | 5.9 g | 0 g | 4.7 g | 157 mg |
| Olive oil | 11 g | 0 g | 0 g | 1.6 g | 0 mg |
A few things stand out. Spinach and broccoli give more protein per calorie than eggs, which surprises most people, though you'd need a very large bowl to eat 100 calories of them. Chicken breast and Greek yogurt give the most protein for the calories. Raspberries give the most fiber of anything on the list. Cheddar gives decent protein but also 4.7 g of saturated fat per 100 calories, almost a quarter of the 20 g Daily Value. Olive oil gives fat and nothing else on this list, which doesn't make it bad, it just means its nutritional value comes from the type of fat rather than protein or fiber.
Per-calorie numbers aren't the whole story of nutritional value. Nobody eats 435 grams of raw spinach, and almonds are worth eating even though they rank low here, because a small handful brings healthy fats and some fiber. Use the table to find good swaps and good additions, not to cut foods out. A food's nutritional value depends on what the rest of your plate already gives you. You can look up more foods by calories and portion in the food nutrition pages.
Examples of nutritional value
Here are a few real examples of nutritional value, each from USDA data used on our food pages. Each one shows a food that's strong in a particular nutrient, and each is an example of nutritional value you can check on a label or in a database.
- Carrots and vitamin A. A 3 oz serving of raw carrots gives 586 mcg of vitamin A, 65% of the Daily Value, plus 201 mg of potassium. The vitamin A comes from beta-carotene. See the carrot nutrition page for baby and cooked carrots.
- Oranges and vitamin C. A medium navel orange gives 83 mg of vitamin C, 92% of the 90 mg Daily Value, along with 232 mg of potassium and 60 mg of calcium.
- Chicken breast and protein. Cooked skinless chicken breast has 31 g of protein per 100 g and only 165 calories. The chicken breast nutrition page breaks it down by ounce and by breast.
- Lentils and fiber. 100 g of cooked lentils gives 7.9 g of fiber and 9 g of protein for 116 calories, with almost no fat or sodium.
- Dark chocolate and iron. Dark chocolate with 70 to 85% cacao has 11.9 mg of iron per 100 g, or 3.4 mg per ounce, 19% of the Daily Value. It's also high in calories, so it works as a small treat rather than an iron source.
- Greek yogurt and protein. Plain nonfat Greek yogurt has 10.2 g of protein per 100 g for 59 calories.
Fruit is a good example of why per-calorie thinking helps. Fruits are mostly water, so most of them give vitamins and fiber for few calories. The low-calorie fruits list ranks them per 100 grams and per serving.

How to compare product nutrition
Packaged foods make comparing nutritional value easier, because the Nutrition Facts label already lists the numbers. Comparing product nutrition well comes down to a few steps. For every line on the panel, see how to read nutrition facts labels.
1. Line up the serving sizes
Two cereals may list 1 cup and 3/4 cup as a serving. If you compare the label numbers as printed, you're not comparing the same amount. Check the serving size first, and scale one product so both match, or compare per 100 grams, which many labels outside the US also show.
2. Use %DV with the 5/20 rule
The %DV column turns each nutrient value into a share of the Daily Value, so you can see how much one serving adds toward it. FDA's guide to the label gives a simple rule: 5% DV or less of a nutrient per serving is low, and 20% DV or more is high. You want fiber, vitamin D, calcium, iron and potassium near the high end, and saturated fat, sodium and added sugars near the low end.
3. Check calories against what you get
When two products have similar protein or fiber, the one with fewer calories usually has the better nutritional value, since you get the same nutrient value for less energy. When two products have similar calories, pick the one with more of the nutrients you want and less of the ones to limit.
4. Read the ingredients
Ingredients are listed by weight, from most to least. If sugar or refined flour is near the top, the product is mostly that. The 2025–2030 Dietary Guidelines advise avoiding highly processed packaged foods that are salty or sweet, such as chips, cookies and candy, and limiting artificial flavors, petroleum-based dyes and artificial preservatives.
Example: three dairy foods
Here's a product comparison using 100 calories of each, from the table above.
| Per 100 kcal | Greek yogurt, nonfat | Cottage cheese | Cheddar |
|---|---|---|---|
| Amount | 169 g | 123 g | 24 g |
| Protein | 17.3 g | 12.8 g | 5.9 g |
| Saturated fat | 0.2 g | 1.5 g | 4.7 g |
| Sodium | 61 mg | 380 mg | 157 mg |
On protein, Greek yogurt has the best nutritional value of the three. Cottage cheese is a close second for protein but carries the most sodium. Cheddar gives the least protein and the most saturated fat for the calories, but it's also the smallest portion, so a slice on a sandwich is still a reasonable choice. None of these is a "bad" food. The comparison just shows whose nutritional value fits a given goal.
If you make your own food and want a label for it, the nutrition label maker builds an FDA-style Nutrition Facts panel from your ingredients, and the recipe nutrition calculator works out the numbers per serving.
Comparing two meals
The same idea works for whole meals. Take a grain bowl made from 150 g of cooked quinoa, 100 g of black beans, 80 g of red pepper, half a small avocado (50 g), 30 g of salsa and a handful of romaine. From USDA data, it comes to about:
- 428 calories
- 18 g of protein
- 19 g of fiber, about 69% of the 28 g Daily Value
- 1.6 g of saturated fat
- 235 mg of sodium, about 10% of the Daily Value
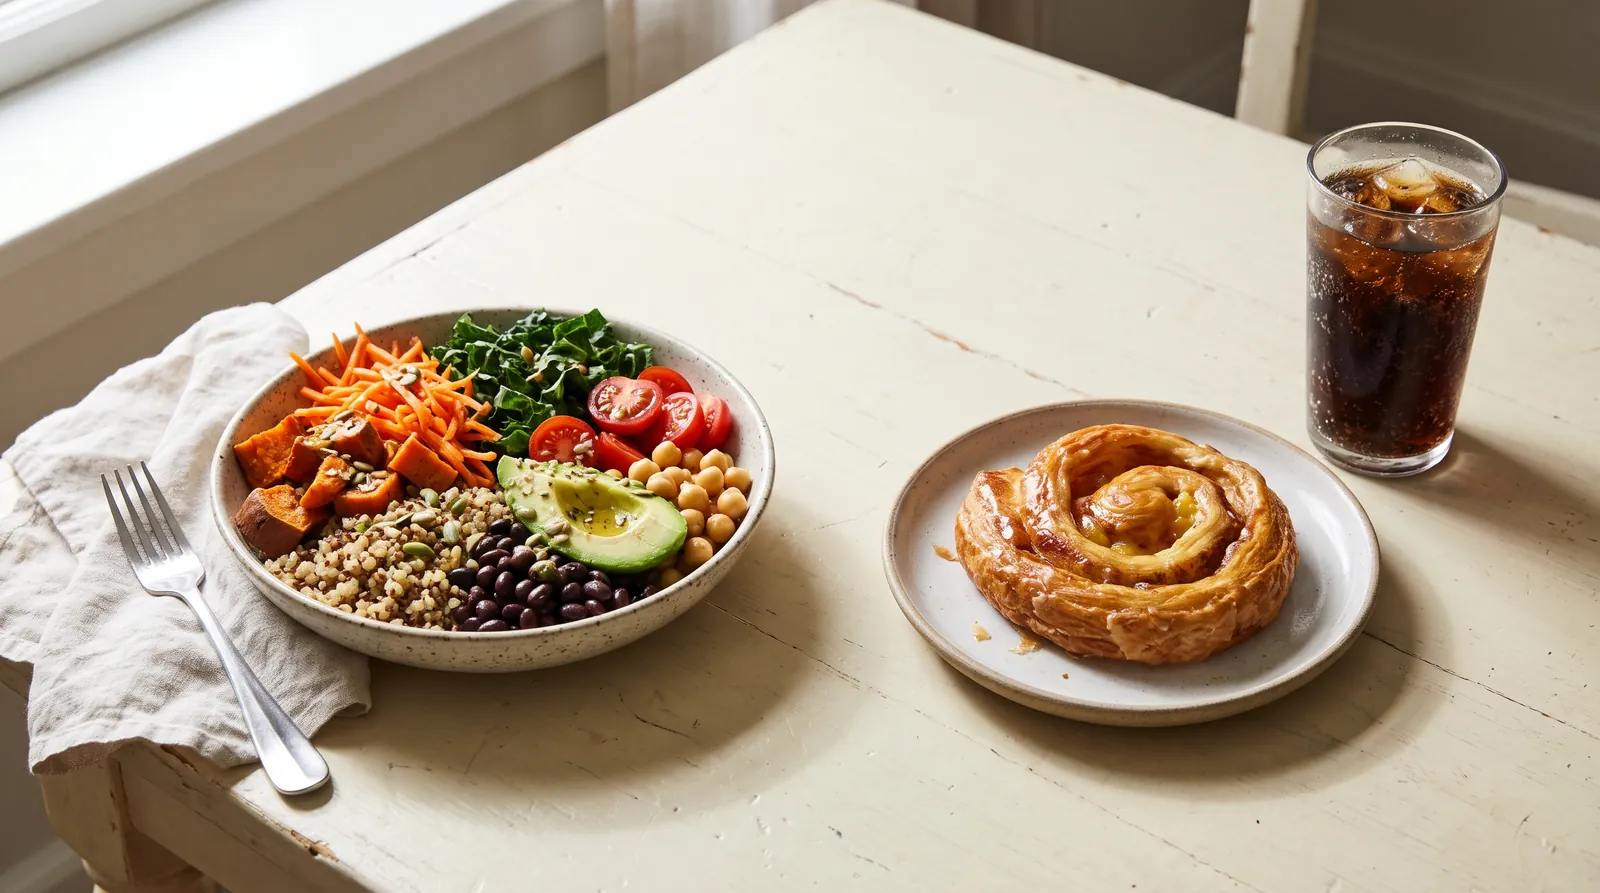
Now picture a pastry and a regular soda with about the same calories. Most of those calories come from refined flour, fat and sugar, with very little fiber or protein, and a regular soda is almost all added sugar. The Dietary Guidelines name sugar-sweetened beverages such as sodas, fruit drinks and energy drinks as something to avoid, and advise that one meal contain no more than 10 grams of added sugars. Same calories, very different nutritional value: the bowl covers a big share of the day's fiber, and the pastry and soda cover very little. If you want protein in the bowl too, adding 100 g of chicken breast brings it to about 593 calories and 49 g of protein.
Nutrition goals examples
Knowing a food's nutritional value is useful once you have something to aim for. Here are nutrition goals examples with numbers from the FDA Daily Values and the 2025–2030 Dietary Guidelines. Pick one or two, not all of them at once.
| Goal | Target | Source |
|---|---|---|
| Eat enough fiber | 28 g a day | FDA Daily Value |
| Eat enough protein | 1.2–1.6 g per kg of body weight a day | Dietary Guidelines 2025–2030 |
| Eat vegetables and fruit | 3 servings of vegetables and 2 of fruit a day (2,000 kcal) | Dietary Guidelines 2025–2030 |
| Keep sodium in check | Under 2,300 mg a day (ages 14 and up) | Dietary Guidelines 2025–2030 |
| Limit saturated fat | Under 10% of daily calories | Dietary Guidelines 2025–2030 |
| Limit added sugar | No more than 10 g in one meal | Dietary Guidelines 2025–2030 |
| Skip sugary drinks | Avoid sodas, fruit drinks and energy drinks | Dietary Guidelines 2025–2030 |
To turn the protein goal into grams, multiply your weight in kilograms by 1.2 and by 1.6. Someone who weighs 70 kg would aim for about 84 to 112 g of protein a day. For saturated fat, 10% of a 2,000-calorie day is 200 calories, which is about 22 g, since fat has 9 calories per gram.
Goals work better when they're specific, and they make the nutritional value of each food easier to judge. "Eat healthier" is hard to check. "Add a vegetable to lunch and dinner" or "reach 28 g of fiber on most days" are easy to track. The fiber calculator and the fat intake calculator give personal targets, and the calorie counter lets you log a day and see the totals.
Sample goals for different situations
- Losing weight: eat protein at every meal and fill half the plate with vegetables, so meals stay filling at fewer calories. Your calorie target comes from the TDEE calculator.
- Building muscle: reach the upper end of 1.2 to 1.6 g of protein per kilogram, spread across meals.
- Lowering sodium: cook at home more often and pick packaged foods with 5% DV or less of sodium per serving.
- Eating more plants: add one serving of beans or lentils a few times a week, which adds both fiber and protein.
The most important nutrition habits
If you take only a few things from this, these are the most important nutrition points, all drawn from the 2025–2030 Dietary Guidelines and the FDA label guidance.
- Build meals on whole, nutrient-dense foods. The guidelines list protein, dairy, vegetables, fruits, healthy fats and whole grains as the base.
- Prioritize protein at every meal. The guidelines say to "prioritize high-quality, nutrient-dense protein" and to eat a variety of protein foods, from animal and plant sources.
- Eat a variety of colorful vegetables and fruits. Different colors tend to bring different vitamins, like vitamin A in carrots and vitamin C in oranges.
- Cut back on highly processed foods. The guidelines tie them to refined carbohydrates, added sugars, excess sodium and unhealthy fats.
- Get calories right. Even the most nutritious foods add up. The best nutritional value comes from foods that give a lot of nutrients inside the calories you need.
For a full day built on these points, the balanced diet guide has a sample menu, and the Eatwell Guide post shows the UK version of the same idea.
Nutritional value FAQ
What is nutritional value?
Nutritional value is what a food gives your body: its calories, protein, carbohydrates, fat and fiber, plus vitamins and minerals. A food with high nutritional value gives a lot of useful nutrients for the calories it contains.
What is nutrient value?
Nutrient value is the amount of a single nutrient in a food, such as 83 mg of vitamin C in a navel orange. The nutritional value of the food is the whole set of those numbers together.
How do you compare the nutritional value of two foods?
Compare them at the same calories, for example per 100 calories, or use the %DV on the label. FDA says 5% DV or less of a nutrient per serving is low and 20% DV or more is high.
Which foods have the highest nutritional value?
Per calorie, vegetables like spinach and broccoli, lean proteins like fish, chicken and Greek yogurt, beans and lentils, and berries rank near the top. They give a lot of protein, fiber, vitamins or minerals without many calories.
What are examples of nutrition goals?
Examples include eating 28 grams of fiber a day, keeping sodium under 2,300 mg, eating 1.2 to 1.6 grams of protein per kilogram of body weight, having 3 servings of vegetables and 2 of fruit, and keeping saturated fat under 10% of calories.
Sources
- U.S. Department of Agriculture. FoodData Central.
- U.S. Food and Drug Administration. Daily Value on the Nutrition and Supplement Facts labels.
- U.S. Food and Drug Administration. How to understand and use the Nutrition Facts label.
- U.S. Departments of Health and Human Services and Agriculture. Dietary Guidelines for Americans, 2025–2030, January 2026.